While discussing the Nardelli/Home Depot flap with my partner yesterday morning, I contended that the reason for Home Depot's lackluster total returns under Nardelli are probably accounted for by the pattern of sales growth during his reign. My partner asked me to compare Lowes and Home Depot to see if my contention is correct. During the recent flare up of criticism over Nardelli's handling of Home Depot's annual meeting, several people commented that Nardelli has turned the company around, in terms of fundamental operating performance. He is apparently pitied for doing the right operating things, but getting "no credit" from the market, in the form of total returns for his shareholders. I wanted to see if this is, in fact, true, as did my partner.
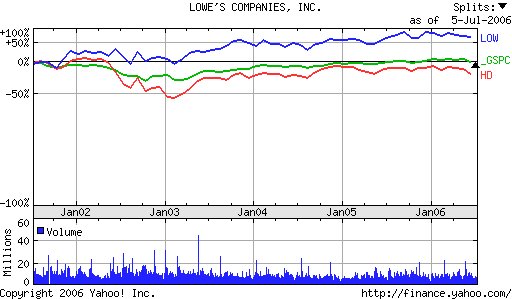 In order to evaluate these comments, I first looked at a Yahoo chart of Lowes and Home Depot's stock prices over the past 5 years. As I mentioned in a prior post, Lowes has clearly outperformed over this recent period.
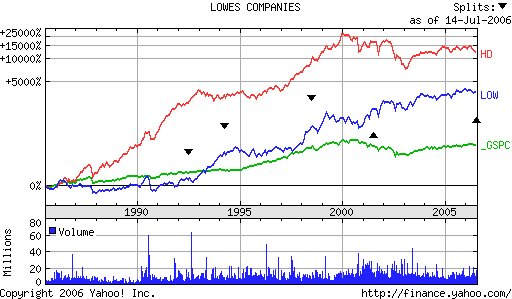 This is in stark contrast to the longer term performance of the two companies' stock prices. The Yahoo price chart at the left, going back to 1985, shows a much different picture.
Here, we see that Home Depot was on a tear, until ....oops...2000. Just before Nardelli took over, the company hit a flat spot, from which it has yet to recover. In fact, it's stock price has actually declined since Nardelli took the helm.
Lowes, on the other hand, has had a rather constant, although slower, stock price rise over the last 21 years. It was a little flat in the late '80s, then began a reasonably monotonic rise in stock price that continued until very recently.
Over the entire period, Home Depot was the better investment, and both Lowes and Home Depot outperformed the S&P500 Index. But, these views don't include dividends, in case they make a significant difference, nor fundamental data, such as sales or profit growth.
 For that view, I went to my Compustat data and retrieved the total returns, sales and NIAT data for Lowes and Home Depot from July, 1999, to June, 2006. The table at the left displays the performances for the two companies on these fundamental and technical dimensions. You may click on it to see the enlarged view.
The top two rows display the annual nominal sales growth of the two companies since 2000. Leaving out 2000, in order to only measure the Nardelli years, we see that Lowes has an average annual sales growth of 13% during the period. This is 1.42x that of Home Depot's average annual sales growth of 9%. That seems to be to be a good reason why Lowes has done better for its shareholders lately. But look at the worst sales growth years for each firm. Lowes never dropped below 10%, while Home Depot had two years in which its sales growth was 3% and an 8%. And these were after 2002, well into the Nardelli era.
If Bob Nardelli has turned Home Depot around, we haven't seen it in the sales growth numbers.
Looking at NIAT (net income after tax), we see a similar pattern. Lowes' average annual NIAT growth is 1.66x that of Home Depot, or 18% vs. 11%. Again, Lowes' worst year featured an 8% growth rate, while Home Depot's was -1%. A decline. Not good for investor confidence.
Here, again, we see no evidence of the 'Nardelli operating turnaround' at Home Depot. I have to confess, I just don't see what Welch, Maria Bartiromo, and others are squawking about. Nardelli's company has lousy stock price performance because its operating performance is uneven and below that of its major competitor.
But, just to be thorough, let's take a look at the actual annual total returns since 2001. That is the third set of paired rows of data in the table. Home Depot's simple average annual return for the period is -4%. Lowes earned an average annual total return of 23% for the same period. Neither company has had a very consistent total return. Which would be at least one reason why neither would be among my equity portfolio selections for the past few years.
However, it seems pretty clear to me that, since 2001, Lowes has exhibited higher and more consistent sales and income growth than has Home Depot. The data doesn't seem to support a "turnaround" by Nardelli, unless his company was doing even worse before he got there. But the stock price data suggest that isn't true.
When you look at the data, Nardelli hasn't performed well for his shareholders on fundamental operating measures like sales and income growth. Is it really surprising the stock price is down, and the company's total returns have trailed both its major competitor, Lowes, and the S&P?

2 comments:
iT SEEMS THAT THE MORE HIS WAGES AND BONUSES INCREASES THE MORE MONEY HE IS TAKING FROM THE SHAREHOLDERS SHARE OF THE PROFITS. SOME SAY HE GOT SPECIAL BOARD MEMBERS IN, IN ORDER TO GRANT HIM THESE EXCESSIVE INCREASES AGAIN AT THE EXPENSE OF THE SHAREHOLDERS.
I worked for HD from 1999-2003 and Lowes from 2003-2006......Both stores in the Las Vegas market....
The best company in all catagorys
LOWES - hands down
Post a Comment